Body fat percentage calculator
What percentage of your weight is fat? A tape measure gets you a long way. Measure your neck and waist (and hips if you are a woman), enter your height and age, and see your estimated body fat percentage, with the range that goes with a healthy weight at your age. No tape measure? Then the calculator estimates it from your height and weight.
Just below your Adam's apple.
At the level of your navel.
Your estimated body fat
16%
- Fat mass
- 13 kg
- Fat-free mass (muscle, bone, organs, water)
- 67 kg

Workouts, nutrition and cardio in 1 app: Fuse
Free for iPhone. Android coming soon.

How to measure properly
- Measure on bare skin, standing relaxed and upright.
- Keep the tape snug but not tight, and level (at your neck it may slope down slightly at the front).
- Measure your neck just below your Adam's apple.
- Men measure the waist at the navel. Women measure at the narrowest point, about halfway between the navel and the bottom of the breastbone. Breathe out normally and do not pull your stomach in.
- Women measure the hips where the buttocks stick out the most, seen from the side.
- Measure each spot two or three times and use the average.
The US Navy formula
The formula comes from two 1984 US Navy reports (Hodgdon and Beckett), based on 602 men and 214 women. The bigger your waist compared with your neck and height, the higher the result; for women the hips count too.
Male: % = 495 / (1.0324 − 0.19077 × log10(waist − neck) + 0.15456 × log10(height)) − 450
Female: % = 495 / (1.29579 − 0.35004 × log10(waist + hips − neck) + 0.22100 × log10(height)) − 450
All measurements in centimeters. We show a whole number: a decimal would suggest more precision than there is.
How accurate is the Navy method?
Compared with a DXA scan, the formula was off by 1 to 6 percentage points on average in military studies, usually too low in men. For one person it can be more: for at least half of the people, the difference was more than 3 percentage points. In lean people the result often comes out too high, and in people with more fat too low.
A tape measure is too rough to show whether you lost fat over a few weeks: in an 8-week study it often missed the change. To follow your progress, look at your waist measurement and your weight rather than the body fat percentage.
Body fat chart by age and sex
The chart comes from a study of 1,626 adults (Gallagher, 2000). It shows the average body fat that goes with a BMI of 18.5, 25 and 30: the limits of a healthy weight, overweight and obesity. The researchers themselves call the ranges provisional.
| Men, age | Healthy weight | Overweight | Obesity |
|---|---|---|---|
| 20–39 | 8–20% | 20–25% | 25% and up |
| 40–59 | 11–22% | 22–28% | 28% and up |
| 60–79 | 13–25% | 25–30% | 30% and up |
| Women, age | Healthy weight | Overweight | Obesity |
|---|---|---|---|
| 20–39 | 21–33% | 33–39% | 39% and up |
| 40–59 | 23–34% | 34–40% | 40% and up |
| 60–79 | 24–36% | 36–42% | 42% and up |
These are not limits for disease, and the chart was not made for athletes: people who did more than 6 hours of hard training a week were not included in the study. The lowest limit is the least certain. The chart is for African American and white adults combined. Asian adults (Japanese in the study) usually carry more fat at the same BMI: from 20 to 39, 13–23% (men) and 25–35% (women) goes with a healthy weight.
The tape measure is a few percentage points off. If you are close to a limit, your range may be a different one. The chart starts at 20 and stops at 79; if you are 18 or 19, the calculator shows the 20–39 row.
Body fat from height and weight
No tape measure? Choose "Height and weight only" in the calculator. It then estimates your body fat from your BMI, age and sex, with the Deurenberg formula (1991), developed in the Netherlands:
Body fat % = 1.20 × BMI + 0.23 × age − 10.8 × sex − 5.4 (male 1, female 0)
A woman of 30 with a BMI of 24 comes out at about 30%, a man of 40 with a BMI of 26 at about 24%. In the study, that estimate was within about 4 percentage points for about 2 in 3 adults. With a BMI of 33 or more, it came out almost 2 points too high on average. The formula does not know your muscle: with a lot of muscle it probably comes out too high.
Ways to measure body fat compared
| Method | How accurate |
|---|---|
| Tape measure (this calculator) | 1 to 6 percentage points off a DXA scan on average |
| From your BMI (height, weight and age) | Within 4 percentage points for 2 in 3 people |
| Skinfold calipers, by a trained tester | About 4 percentage points; depends a lot on the tester |
| Scale with electrodes | Varies a lot by device: on average from 3.5 too low to 11.7 too high |
| DXA scan at a clinic | One of the most accurate, but it can also be a few points off |
| Underwater weighing or Bod Pod, in a lab | About 2 to 3 percentage points too low |
Accuracy was always compared with a better measurement. The best one combines several measurements (the four-compartment model), but it only exists in research; the chart by age above was made with it. Two DXA machines do not always agree either.
Whichever method you choose, only compare results from the same device or method. Scales with electrodes vary a lot from one device to the next, and the result also depends on how much water your body is holding.
What is a healthy body fat percentage?
You always need some fat: it is part of your nerves and cell membranes. Nobody knows exactly how much. There is also no generally accepted healthiest body fat percentage for athletes, and eating too little to get as lean as possible can harm your health and your performance.
For most adults, the chart by age above is the best guide. On other sites you often see the chart of the American Council on Exercise (ACE), a fitness organization:
| ACE category | Men | Women |
|---|---|---|
| Essential fat | 2–5% | 10–13% |
| Athletes | 6–13% | 14–20% |
| Fitness | 14–17% | 21–24% |
| Acceptable | 18–24% | 25–31% |
| Obesity | 25% and up | 32% and up |
ACE does not cite research for it, and the limits are not by age. They also differ: a 30-year-old woman with 32% is "obesity" for ACE, while in the chart by age that goes with a healthy weight.
Want to lower your body fat? Work out your calorie needs and how much protein you need: strength training and enough protein help you keep muscle while you lose weight.
Frequently asked questions
What is the most accurate way to measure body fat?
Why is my result different from my scale?
How fast can I lower my body fat?
Does the US Army still use the tape test?
This calculator gives an estimate for adults 18 and older and is not a medical measurement.
Sources
- Hodgdon, J.A. and Beckett, M.B. (1984). Prediction of percent body fat for U.S. Navy men from body circumferences and height. Naval Health Research Center, report 84-11.
- Hodgdon, J.A. and Beckett, M.B. (1984). Prediction of percent body fat for U.S. Navy women from body circumferences and height. Naval Health Research Center, report 84-29.
- Department of Defense (2002). DoD Instruction 1308.3: DoD Physical Fitness and Body Fat Programs Procedures (archived).
- Gallagher, D. et al. (2000). Healthy percentage body fat ranges: an approach for developing guidelines based on body mass index. Am J Clin Nutr 72(3), 694-701.
- Potter, A.W. et al. (2022). Circumference-based predictions of body fat revisited: preliminary results from a US Marine Corps body composition survey. Front Physiol 13, 868627.
- Taylor, K.M. et al. (2024). Development and cross-validation of a circumference-based predictive equation to estimate body fat in an active population. Obes Sci Pract 10, e747.
- Foulis, S.A. et al. (2023). Body composition changes during 8 weeks of military training are not accurately captured by circumference-based assessments. Front Physiol 14, 1183836.
- Deurenberg, P. et al. (1991). Body mass index as a measure of body fatness: age- and sex-specific prediction formulas. Br J Nutr 65(2), 105-114.
- Jackson, A.S. et al. (1980). Generalized equations for predicting body density of women. Med Sci Sports Exerc 12(3), 175-181.
- Siedler, M.R. et al. (2023). Assessing the reliability and cross-sectional and longitudinal validity of fifteen bioelectrical impedance analysis devices. Br J Nutr 130(5), 827-840.
- Tinsley, G.M. (2021). Five-component model validation of reference, laboratory and field methods of body composition assessment. Br J Nutr 125(11), 1246-1259.
- Kasper, A.M. et al. (2021). Come back skinfolds, all is forgiven: a narrative review of the efficacy of common body composition methods in applied sports practice. Nutrients 13(4), 1075.
- Fields, D.A. et al. (2002). Body-composition assessment via air-displacement plethysmography in adults and children: a review. Am J Clin Nutr 75(3), 453-467.
- Heymsfield, S.B. et al. (2024). Are lean body mass and fat-free mass the same or different body components? A critical perspective. Adv Nutr 15, 100335.
- Sundgot-Borgen, J. et al. (2013). How to minimise the health risks to athletes who compete in weight-sensitive sports (IOC). Br J Sports Med 47, 1012-1022.
- Mountjoy, M. et al. (2023). 2023 International Olympic Committee's (IOC) consensus statement on Relative Energy Deficiency in Sport (REDs). Br J Sports Med 57, 1073-1097.
- Aragon, A.A. et al. (2026). International Society of Sports Nutrition position stand: diets for body weight reduction. J Int Soc Sports Nutr 23, 2740266.
- Aragon, A.A. et al. (2017). International Society of Sports Nutrition position stand: diets and body composition. J Int Soc Sports Nutr 14, 16.
- Helms, E.R. et al. (2014). Evidence-based recommendations for natural bodybuilding contest preparation: nutrition and supplementation. J Int Soc Sports Nutr 11, 20.
- U.S. Army (2026). Army Directive 2026-13: Army Body Composition Program and Standards.
- McClung, H.L. et al. (2025). Science behind policy: implementing a modern circumference-based body fat equation with a physical fitness threshold is associated with lower musculoskeletal injury risk. Int J Obes 49, 723-730.
- American Council on Exercise: percent body fat calculator and categories (archived, December 2023).
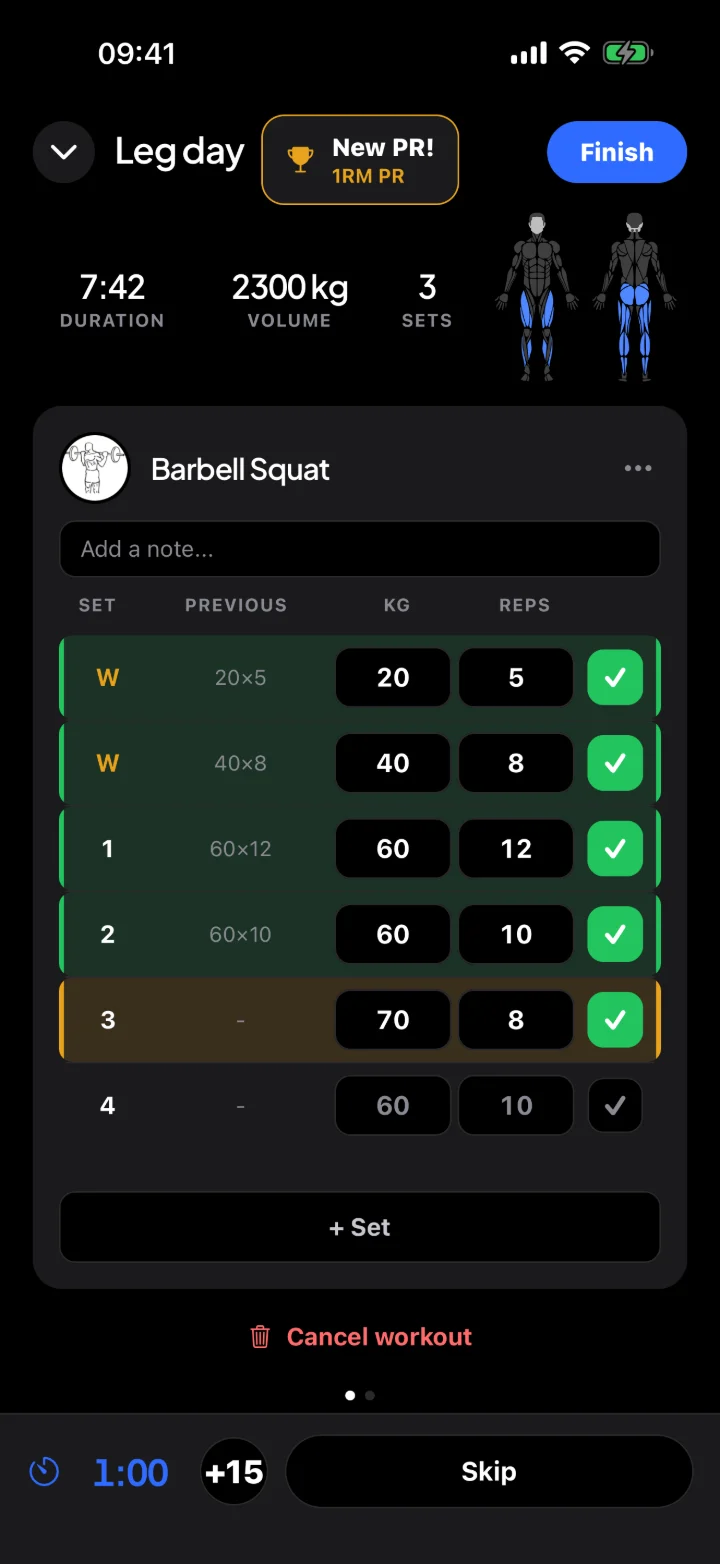
Train and eat for your goal with Fuse.
Log your sets in a few taps and track your food in the same app.
- Your last weights, already filled in
- Muscle map of your training week
- Snap a photo, the AI recognizes your meal
Free for iPhone. Android coming soon.
Scan with your iPhone
Keep calculating
- BMI calculatorYour BMI and a healthy weight for your height.
- Calorie calculatorHow many calories you need per day (TDEE and BMR).
- Protein calculatorHow many grams of protein per day, per goal.
- Macro calculatorProtein, carbs and fat in grams per day.
- 1RM calculatorYour one rep max from a heavy set.
- Calories burned calculatorHow many calories you burn per activity.